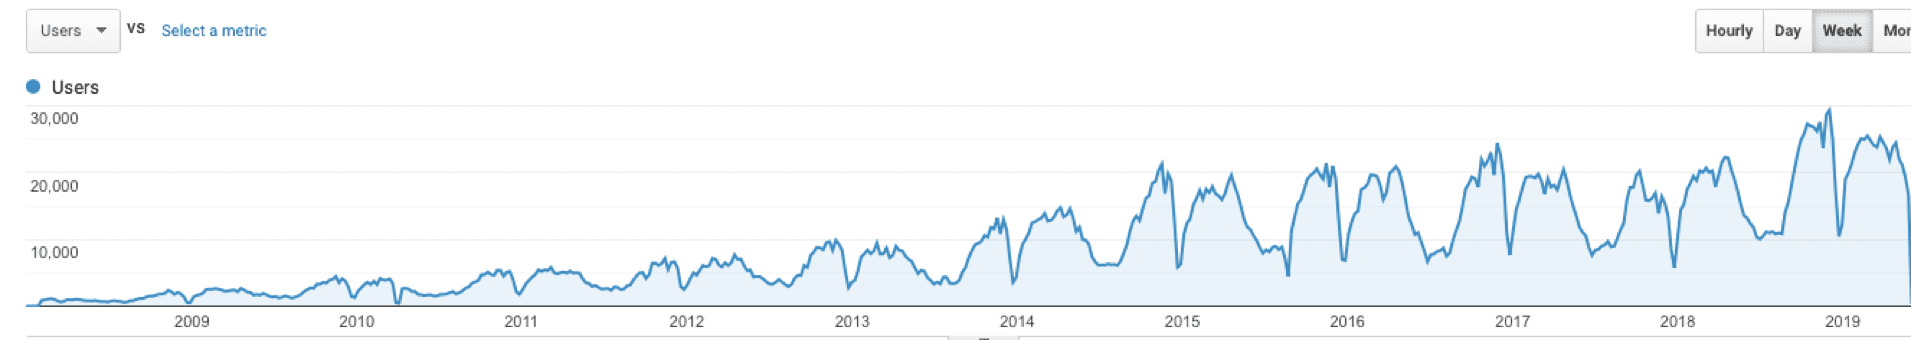
ChemTube3D.com has been available to the public as an Open Educational Resource since January 2008. In the period up to June 2019 there had been 4.8 million visitors to the site from 216 different countries. In the year to June 2019 there were >867,000 unique visitors up 30% from 2018 with a recent peak during term time of 5200/day.
The weekly usage is shown below for the entire period with a weekly peak of 27,000 visitors just before Xmas 2018
The most active University networks in the year to June 2019 (a measure of usage on campus within those institutions) were the following in decreasing order: Oxford, Cambridge, Manchester, Liverpool, Irvine, Washington, Texas Austin, Emory, Minnesota, UCLA.
In recent years there has been a significant growth in the proportion of users visiting the site on mobile devices (ca 40%). Notwithstanding the availability of apps for iOS and Android for sections of the site, a complete redesign to better serve both desktop and mobile users was undertaken in 2019. This is the result.
There are currently ca. 2400 pages in ChemTube3D and they have all been reworked to make them responsive. If you spot anything that is not working properly or something that you don’t like please let me know.
Provided by the